How can career centers build reporting systems that leadership actually uses?
Career centers can improve reporting effectiveness by shifting from activity summaries toward decision-oriented reporting systems. Strong reporting frameworks connect engagement, readiness, employer activity, outcomes, equity gaps, and operational trends to clear institutional implications, recommended actions, and leadership decisions across monthly, quarterly, and annual reporting cycles.
Most career center reports still read like activity logs: appointments completed, workshops hosted, career fair attendance, and employer events delivered.
Those numbers matter, but they rarely explain what changed for students or what leadership should do next.
That gap matters because provosts, deans, and student success leaders need more than service volume.
They need to understand whether career services is improving readiness, expanding access, strengthening employer pipelines, supporting outcomes, and identifying where investment is needed.
This guide gives career centers practical monthly, quarterly, and annual reporting templates, including executive summary formats, advisor contribution sections, employer engagement reporting, metrics by cadence, and recommendation templates for leadership.
What Should a Career Center Reporting Template Include?
A career center reporting template should include the reporting period, audience, headline findings, core metrics, interpretation, recommended actions, and follow-up owner. The goal is not to list every activity. It is to help stakeholders understand what happened, why it matters, and what decision should follow.
A strong report template should make three things clear:
- What changed? Student engagement, readiness, employer activity, outcomes, or equity gaps.
- Why does it matter? Connection to institutional goals such as retention, graduate outcomes, access, or ROI.
- What should happen next? A decision, intervention, resource request, or workflow change.
The biggest reporting mistake is separating data from action. A report that says “800 students attended events” is incomplete.
A stronger report says which students attended, which high-value events were underused, which groups were missing, and what the center will change next month or next term.
Career Center Reporting Templates at a Glance
Use this table to choose the right report format based on audience, cadence, and decision type.
| Template | Best Used For | Primary Audience | Metrics to Include | Decision It Supports |
|---|---|---|---|---|
| Monthly Operations Report | Short-term service monitoring and operational visibility | Career center director, team leads, and advisors | Appointments, wait times, event attendance, resume reviews, no-shows, and staff workload | Workflow adjustments, staffing allocation, outreach prioritization, and service optimization |
| Quarterly Leadership Report | Trend analysis, intervention planning, and institutional alignment | Deans, VP student affairs, provost’s office, and student success leaders | Engagement trends, readiness progress, cohort movement, employer activity, and equity gaps | Program redesign, resource allocation, and targeted student interventions |
| Annual Impact Report | Institutional storytelling and year-end strategic reporting | Senior leadership, trustees, employers, and campus partners | First-destination outcomes, year-over-year reach, employer growth, readiness gains, and major initiatives | Budget planning, institutional positioning, and long-term strategic priorities |
| Executive Summary | Fast leadership review and high-level briefing preparation | Provosts, deans, and VP student affairs leaders | 3–5 headline findings, major wins, institutional risks, and key recommendations | Rapid decision-making, executive meetings, and leadership briefings |
| Advisor Contribution Report | Showing advising impact beyond appointment volume | Career center leaders and advising managers | Action-plan completion, student confidence, readiness milestones, referrals, and follow-up completion | Advisor development, workload planning, and quality improvement initiatives |
| Employer Engagement Report | Evaluating recruiting partnerships and employer activity | Employer relations team, deans, and institutional leadership | Active employers, interviews, event participation, postings, and repeat engagement | Employer partnership strategy, recruiting pipeline growth, and relationship development |
| Recommendation / Budget Ask Section | Turning findings into institutional action requests | Senior leadership and budget decision-makers | Key findings, institutional risks, proposed actions, required resources, and expected impact signals | Staffing approvals, technology investment, pilot expansion, and program funding decisions |
Also Read: How Can Career Centers Can Show ROI, Retention, & Real Student Outcomes?
How Should Career Centers Structure Monthly Reports?
Monthly reports should focus on operational health: student demand, service usage, advisor workload, event attendance, follow-up completion, and immediate gaps. The purpose is to help the career center adjust quickly, not to prove long-term institutional impact.
A monthly report should be short enough for internal review and specific enough to change team behavior.
Use monthly reporting to answer:
- Which services are seeing higher demand?
- Which student groups are under-engaged?
- Where are wait times or bottlenecks increasing?
- Which events are converting registrations into attendance?
- Which follow-ups are not being completed?
- Which advisors or teams need more support?
Monthly Career Center Report Template
| Section | What to Include | Example Fields |
|---|---|---|
| Reporting Period | Month covered and comparison period for context | April 2026 vs. March 2026, or April 2026 vs. April 2025 |
| Headline Summary | Three major operational or engagement takeaways | Demand increased, no-shows declined, resume reviews rose significantly |
| Student Engagement | Service usage trends across advising and programming channels | Appointments, drop-ins, workshops, event attendance, and digital tool usage |
| Advisor Workload | Staff capacity, operational pressure, and service responsiveness | Caseloads, wait times, no-shows, and review turnaround time |
| Career Readiness Activity | Signals showing student preparation and progress | Resume revisions, mock interviews, career assessments, and LinkedIn updates |
| Employer Activity | Monthly employer-facing engagement and recruiting activity | Job postings, employer meetings, recruiting events, and interviews scheduled |
| Equity and Access | Participation gaps, underserved populations, or overburdened student groups | Usage by class year, major, first-gen status, Pell status, or commuter population |
| Risks and Blockers | Operational constraints or engagement challenges affecting outcomes | Long wait times, low attendance, weak follow-up completion, or staffing bottlenecks |
| Next-Month Actions | Changes, experiments, or operational adjustments planned by the team | Targeted outreach, expanded drop-ins, staffing changes, or workflow improvements |
What Should a Quarterly Career Center Report Show?
A quarterly career center report should show trends, not just counts. It should compare engagement, readiness, employer activity, and student progress across the term so leaders can identify where services are working, where students are stalling, and which interventions need adjustment.
Quarterly reports are especially useful for leadership because they sit between operational reporting and annual impact reporting. They are frequent enough to support intervention, but broad enough to show patterns.
Use quarterly reports to answer:
- Which services are growing or declining?
- Which student groups are progressing through career milestones?
- Which colleges or majors need more support?
- Which employer activities are generating student opportunities?
- Which readiness behaviors are improving?
- Which gaps require a mid-year intervention?
Quarterly Career Center Report Template
| Section | What to Include | Example Fields |
|---|---|---|
| Executive Snapshot | 3–5 high-level findings summarizing the quarter | Engagement trends, readiness movement, employer activity shifts, and major institutional gaps |
| Student Engagement Trends | Usage patterns and engagement movement across the quarter | Appointments, workshops, digital platform activity, repeat engagement, and event participation |
| Career Readiness Progress | Evidence showing student movement toward readiness milestones | Resume revisions, mock interview completion, career plan completion, and assessment progress |
| Employer Pipeline | Recruiting activity and employer engagement patterns | Active employers, job postings, interviews scheduled, recruiting events, and employer participation |
| Cohort Movement | Progress and engagement trends by student segment | Breakdowns by class year, major, academic college, first-gen status, or Pell eligibility |
| Equity and Access Gaps | Participation, conversion, or support gaps across student populations | Students missing services, low-conversion groups, under-engaged populations, or uneven outcomes |
| Operational Bottlenecks | Workflow, staffing, or process constraints affecting service delivery | Advisor workload, wait times, no-shows, incomplete follow-ups, or capacity limitations |
| Recommended Interventions | Priority actions and operational changes for the next quarter | Targeted outreach, faculty partnerships, workshop expansion, staffing shifts, or workflow redesign |
Also Read: Career Center ROI Framework: Metrics, Formulas, and Attribution
How Should Career Centers Build an Annual Impact Report?
An annual career center report should connect the year’s activity to institutional value. It should summarize reach, readiness, employer engagement, outcomes, equity, operations, and priorities for the next year. The annual report should help leadership understand what changed and what investment is needed next.
The annual report should not simply repeat twelve monthly reports. It should synthesize the year.
Use annual reporting to answer:
- How many students did career services reach?
- Which services showed the strongest engagement?
- What readiness gains were visible?
- Which employer partnerships produced opportunities?
- What do first-destination outcomes show?
- Which student groups need additional support?
- What should the institution fund, expand, or redesign next year?
Annual Career Center Report Template
| Section | What to Include | Why It Matters |
|---|---|---|
| Executive Summary | 3–5 major wins, institutional gaps, strategic risks, and key recommendations from the year | Helps leadership quickly understand the overall story and major takeaways |
| Strategic Priorities | Major initiatives, institutional goals, and focus areas the career center prioritized during the year | Connects career center activity to broader institutional strategy and mission |
| Student Engagement | Usage trends by service type, class year, college, and student population | Shows student reach, demand patterns, and engagement distribution |
| Career Readiness | Resume progress, interview preparation, assessments, LinkedIn activity, and readiness milestone completion | Demonstrates student development before employment outcomes occur |
| Employer Relations | Employer partnerships, postings, recruiting events, interviews, and engagement activity | Shows labor-market alignment and employer pipeline strength |
| First-Destination Outcomes | Employment, graduate school, military, service, still-seeking status, and knowledge rate data | Provides evidence of post-graduation outcomes and institutional value |
| Equity and Access | Engagement and outcomes segmented by student populations where data is available | Shows whether support and outcomes are distributed fairly across groups |
| Technology and Operations | Platform adoption, workflow improvements, advisor capacity, reporting systems, and operational infrastructure | Highlights scalability, operational maturity, and infrastructure needs |
| Recommendations | Recommended staffing, budget, technology, partnership, or program changes for the next cycle | Turns reporting insights into actionable institutional decisions |
What Should the Executive Summary Include?
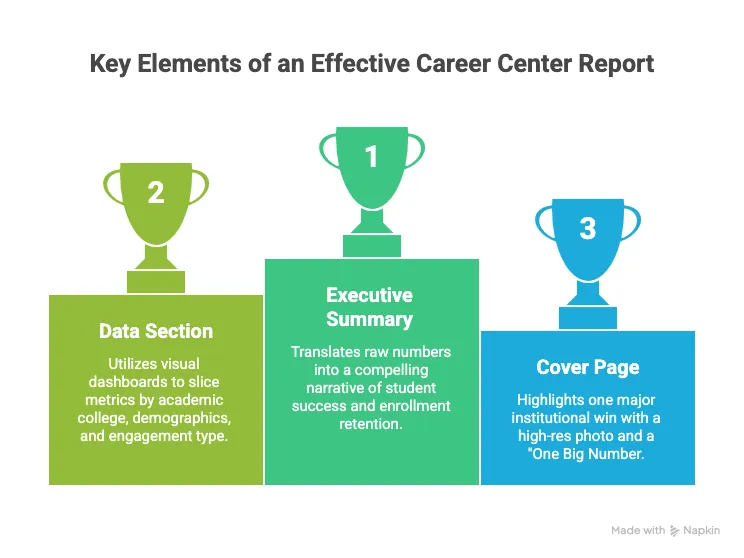
The executive summary should translate the full report into a small number of leadership-ready insights. It should not summarize every section equally. It should highlight the most important wins, risks, and decisions connected to student success, career readiness, employer engagement, and institutional priorities.
A useful executive summary can follow this structure:
- One-sentence report theme
- Three headline findings
- One major risk or gap
- One strategic recommendation
- One next decision needed from leadership
Executive Summary Template
Reporting Period:
Academic year, quarter, or month
Primary Theme:
Example: Career engagement increased, but sophomore participation and employer follow-up need targeted intervention.
Headline Finding 1:
What improved?
Headline Finding 2:
What changed in student readiness, employer activity, or outcomes?
Headline Finding 3:
Which student group, college, or program showed a meaningful pattern?
Primary Risk:
What issue needs leadership attention?
Recommended Action:
What should be funded, expanded, redesigned, or monitored?
Decision Needed:
What does leadership need to approve, review, or prioritize?
Also Read: Career Coaching Session Template: 30 & 45-Minute Advisor Agendas
How Should Career Centers Report Advisor Contributions?
Career centers should report advisor contributions by showing what advising changed, not just how many appointments were completed. Useful advisor reporting includes student goals, action-plan completion, readiness progress, referral accuracy, follow-up completion, and movement toward internships, interviews, or career milestones.
Advisor reporting should move beyond volume.
Instead of reporting only:
1,200 advising appointments completed
Add:
- percentage of students who left with documented action plans
- percentage completing follow-up tasks
- most common advising topics
- readiness milestones completed after sessions
- referral patterns
- average wait time
- student clarity or confidence gains where measured
Advisor Contribution Report Template
| Section | What to Track | Why It Matters |
|---|---|---|
| Advising Volume | Appointments, drop-ins, repeat visits, and advising demand patterns | Shows overall service demand and advisor utilization |
| Advising Focus | Resume support, interview prep, career exploration, internship guidance, job search, and graduate school advising | Reveals the types of student needs and advising priorities emerging over time |
| Action-Plan Completion | Student tasks completed after advising sessions | Shows whether advising translates into measurable student behavior and follow-through |
| Follow-Up Completion | Advisor and student follow-up actions that are successfully closed | Measures accountability, continuity, and advising consistency |
| Readiness Progress | Resume revisions, mock interviews, career assessments, LinkedIn updates, and milestone completion | Shows movement toward career readiness and student development |
| Referral Accuracy | Referrals to employer events, faculty, alumni, financial aid, workshops, or campus support services | Measures coordination quality and advisor knowledge of institutional resources |
| Student Clarity | Post-session confidence, clarity, or direction pulse-check data | Captures student-perceived value and understanding after advising sessions |
| Capacity Signals | Wait times, no-shows, advisor caseloads, and turnaround time | Highlights staffing pressure, operational strain, and capacity planning needs |
How Should Career Centers Report Employer Engagement?
Employer engagement reporting should show more than the number of employers who attended events. A stronger report explains which employers were active, which industries showed demand, which events produced interviews or applications, and where employer partnerships created student opportunity.
Employer reporting is important because career centers often invest significant time in relationship-building without clearly showing the return.
Include:
- active employer partners
- new employer partners
- repeat employer engagement
- job and internship postings
- interviews generated
- career fair participation
- information sessions
- industry representation
- student applications or follow-ups
- employer feedback
- hires reported where available
Employer Engagement Report Template
| Metric Category | Monthly Report | Quarterly Report | Annual Report |
|---|---|---|---|
| Student Engagement | Appointments, drop-ins, event attendance, platform logins, and short-term engagement volume | Engagement trends by class year, major, college, or student cohort | Year-over-year reach, participation growth, and institutional engagement patterns |
| Career Readiness | Resume reviews, mock interviews, career assessments, and milestone completion activity | Readiness movement, milestone progression, and cohort-level development trends | Readiness gains, program effectiveness, and long-term developmental progress |
| Employer Relations | Job postings, employer meetings, recruiting events, and event registrations | Interview activity, employer pipeline movement, and repeat employer engagement | Employer partnership growth, recruiting outcomes, and hiring impact over time |
| Outcomes | Early hiring signals, internship leads, and interview progression activity | Internship conversion rates, interview progression, and pipeline movement | First-destination outcomes, employment data, and institutional knowledge rate |
| Equity and Access | Usage gaps across available student populations and service-access trends | Participation and conversion gaps by student cohort or demographic group | Long-term engagement and outcome gaps across student populations |
| Operations | Wait times, no-shows, advisor workload, and turnaround time | Workflow bottlenecks, staffing pressure, and operational constraints | Capacity planning, staffing justification, and budget recommendations |
| Technology | Tool usage, workflow completion rates, and adoption activity | Adoption trends, workflow impact, and operational integration progress | Technology ROI, scalability, and institutional data-readiness maturity |
How Should Career Centers Frame Recommendations and Budget Asks?
Recommendations should connect a finding to a risk, a proposed action, the resources needed, and the expected signal of improvement. A strong recommendation does not simply say, “We need more budget.” It explains what the data shows and what investment would change.
Never end a leadership-facing report with only a summary. End with a decision path.
Recommendation Section Template
| Field | What to Write | Example | Why It Matters | Review Timing |
|---|---|---|---|---|
| Finding | Summarize the key insight, trend, or performance issue shown by the data | Sophomore engagement dropped 18% compared with the fall term | Frames the core issue leadership needs to understand | Reviewed monthly or quarterly |
| Risk | Explain the institutional or student impact if the issue continues | Students may delay internship preparation until junior year | Connects the finding to retention, readiness, or outcome consequences | Reassess after intervention launch |
| Recommended Action | Describe the operational, programmatic, or strategic response | Launch a sophomore internship-readiness campaign with faculty partners | Turns reporting into an actionable institutional response | Track progress during the next reporting cycle |
| Resources Needed | List staffing, budget, technology, partnerships, or workflow support required | 1 peer advisor team, targeted email workflow, and 3 workshops | Helps leadership evaluate feasibility and operational support needs | Review during budget or staffing discussions |
| Expected Signal | Define the measurable outcome or improvement expected after implementation | Higher resume completion, workshop attendance, and internship applications | Creates accountability and measurable success criteria | Measure during the next quarter |
| Review Timeline | Specify when the intervention or metric should be reassessed | End of next quarter | Ensures continuous evaluation instead of one-time reporting | End of designated review period |
What Should a Report Cover Page Include?
A report cover page should set the strategic frame before readers enter the data. It should include the reporting period, audience, one headline theme, one major outcome or signal, and a short statement connecting the report to institutional priorities.
Avoid cluttering the cover page with too much information.
A strong cover page includes:
- report title
- reporting period
- career center name
- intended audience
- one major theme
- one headline metric or signal
- short institutional relevance statement
Cover Page Template
Report Title:
Career Services Quarterly Impact Report
Reporting Period:
January–March 2026
Prepared For:
Provost, Deans, VP Student Affairs, Student Success Leadership
Prepared By:
Career Center / Career Services Team
Headline Theme:
Early engagement increased, but internship readiness remains uneven across colleges.
One Big Signal:
Example: Resume milestone completion increased by 22% after targeted sophomore outreach.
Institutional Relevance:
This report shows how career services engagement is connected to student readiness, employer activity, and next-quarter intervention priorities.
How Can Career Centers Make Data Sections Easier to Read?
Career centers can make data sections easier to read by grouping metrics around decisions, using plain labels, limiting each section to the most relevant numbers, and adding a short interpretation after every chart or table. Data without interpretation forces leadership to do the work.
Use this format for every major data section:
- Metric: What is being shown?
- Pattern: What changed?
- Interpretation: Why might this be happening?
- Action: What will the center do next?
Example:
Metric: Career fair attendance by class year
Pattern: Senior attendance increased, but sophomore attendance remained low
Interpretation: Sophomores may not see the fair as relevant yet
Action: Add a pre-fair sophomore preparation session tied to internship exploration
This keeps the report from becoming a spreadsheet dump.
Also Read: Which career center metrics should universities track to prove real student outcomes?
How Should Career Centers Use Report Templates Without Over-Reporting?
Career centers should use templates to create consistency, not more reporting burden. Each report should serve a clear audience and decision. If a metric does not help someone understand, intervene, fund, improve, or plan, it probably does not belong in the report.
Before building a report, ask:
- Who will read this?
- What decision do they need to make?
- What data do they trust?
- What level of detail do they need?
- What should happen after they read it?
This prevents monthly, quarterly, and annual reports from becoming repetitive.
A simple rule works well:
- Monthly reports help the team manage work.
- Quarterly reports help leaders adjust strategy.
- Annual reports help the institution understand impact.
Final Career Center Reporting Checklist
Use this checklist before sending a report to leadership.
Structure
- Does the report name its audience and reporting period?
- Is there an executive summary?
- Are the top findings visible early?
- Does each section explain why the data matters?
- Are recommendations included?
Metrics
- Are engagement, readiness, employer activity, outcomes, and equity addressed where relevant?
- Are metrics defined consistently?
- Is the data segmented by college, major, class year, or student group where useful?
- Are monthly, quarterly, and annual metrics separated appropriately?
Interpretation
- Does the report explain what changed?
- Does it identify risks or gaps?
- Does it connect findings to institutional priorities?
- Does it avoid overclaiming causation?
- Does it include next actions?
Design
- Can a busy leader understand the main point in under two minutes?
- Are charts and tables simple?
- Is the report scannable?
- Are dense data tables moved to an appendix?
- Does the cover page set the strategic frame?
Also Read: Career Services Benchmarks: KPI Targets for Career Centers in 2026
Wrapping Up
Career center reporting should not stop at activity counts. Appointments, events, and workshops matter, but they only become useful when they are connected to readiness, employer engagement, outcomes, equity, and decisions.
The strongest reporting templates help career centers separate operational monitoring from leadership reporting.
Monthly reports should help teams manage demand. Quarterly reports should reveal trends and intervention needs. Annual reports should show institutional value and guide strategy for the next year.
Hiration supports this kind of connected reporting by bringing student career activity, AI-powered resume optimization, interview simulation, cohort workflows, and counselor-facing analytics into one platform.
The system helps career teams track student progress, manage workflows, and surface insights within a secure, FERPA and SOC 2-compliant environment.
When reporting templates are structured around decisions, career centers can move from “here is what we did” to “here is what changed, what it means, and what we should do next.”
Career Center Reporting Templates — FAQs
What should a strong career center report include?
Strong reports include key findings, core metrics, interpretation, institutional relevance, recommended actions, and next-step ownership rather than activity counts alone.
Why are activity-only reports no longer enough?
Leadership increasingly expects career centers to demonstrate readiness gains, employer impact, equity outcomes, operational efficiency, and institutional value.
What should monthly career center reports focus on?
Monthly reports should track operational health, including demand patterns, advisor workload, follow-up completion, event conversion, and immediate service bottlenecks.
What makes quarterly reporting different?
Quarterly reports should emphasize trends, intervention needs, engagement movement, employer activity, and readiness progression across student populations.
What should annual career center reports demonstrate?
Annual reports should connect career services activity to institutional outcomes, employer partnerships, student readiness, equity priorities, and strategic investment needs.
What belongs in an executive summary?
Executive summaries should highlight major findings, institutional risks, strategic recommendations, and leadership decisions rather than summarizing every section equally.
How should career centers report advisor contributions?
Advisor reporting should focus on student progress, follow-through, readiness milestones, referral quality, and action-plan completion instead of appointment volume alone.
What makes employer engagement reporting meaningful?
Strong employer reporting explains which partnerships created opportunities, generated interviews, improved industry access, or strengthened recruiting pipelines.
How can career centers make reports easier for leadership to read?
Reports become easier to read when metrics are grouped around decisions, paired with interpretation, and connected directly to recommended actions.
What is the biggest strategic reporting shift career centers need?
Career centers must move from operational activity reporting toward leadership-ready reporting systems that guide funding, intervention, and institutional strategy.