Which career center metrics should universities track to prove real student outcomes?
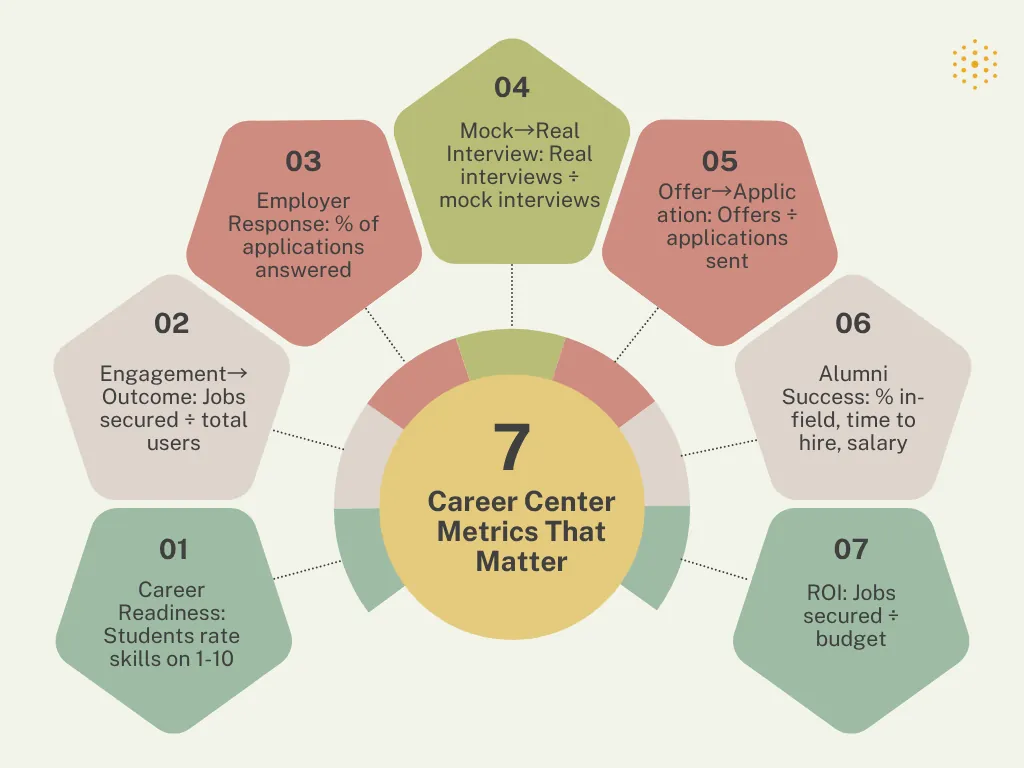
Universities should track outcome-driven metrics such as career readiness scores, engagement-to-outcome ratios, employer response rates, interview conversions, job offer ratios, alumni success, and ROI. These metrics help career centers move beyond activity tracking and demonstrate measurable impact on student employment, readiness, and institutional value.
If you’re trying to evaluate how effective your university’s career services actually are, appointments and event attendance won’t tell you enough.
You need metrics that show whether students are becoming job-ready, whether engagement is translating into interviews and offers, whether employers are responding, and whether your reporting systems can connect career preparation with placement outcomes.
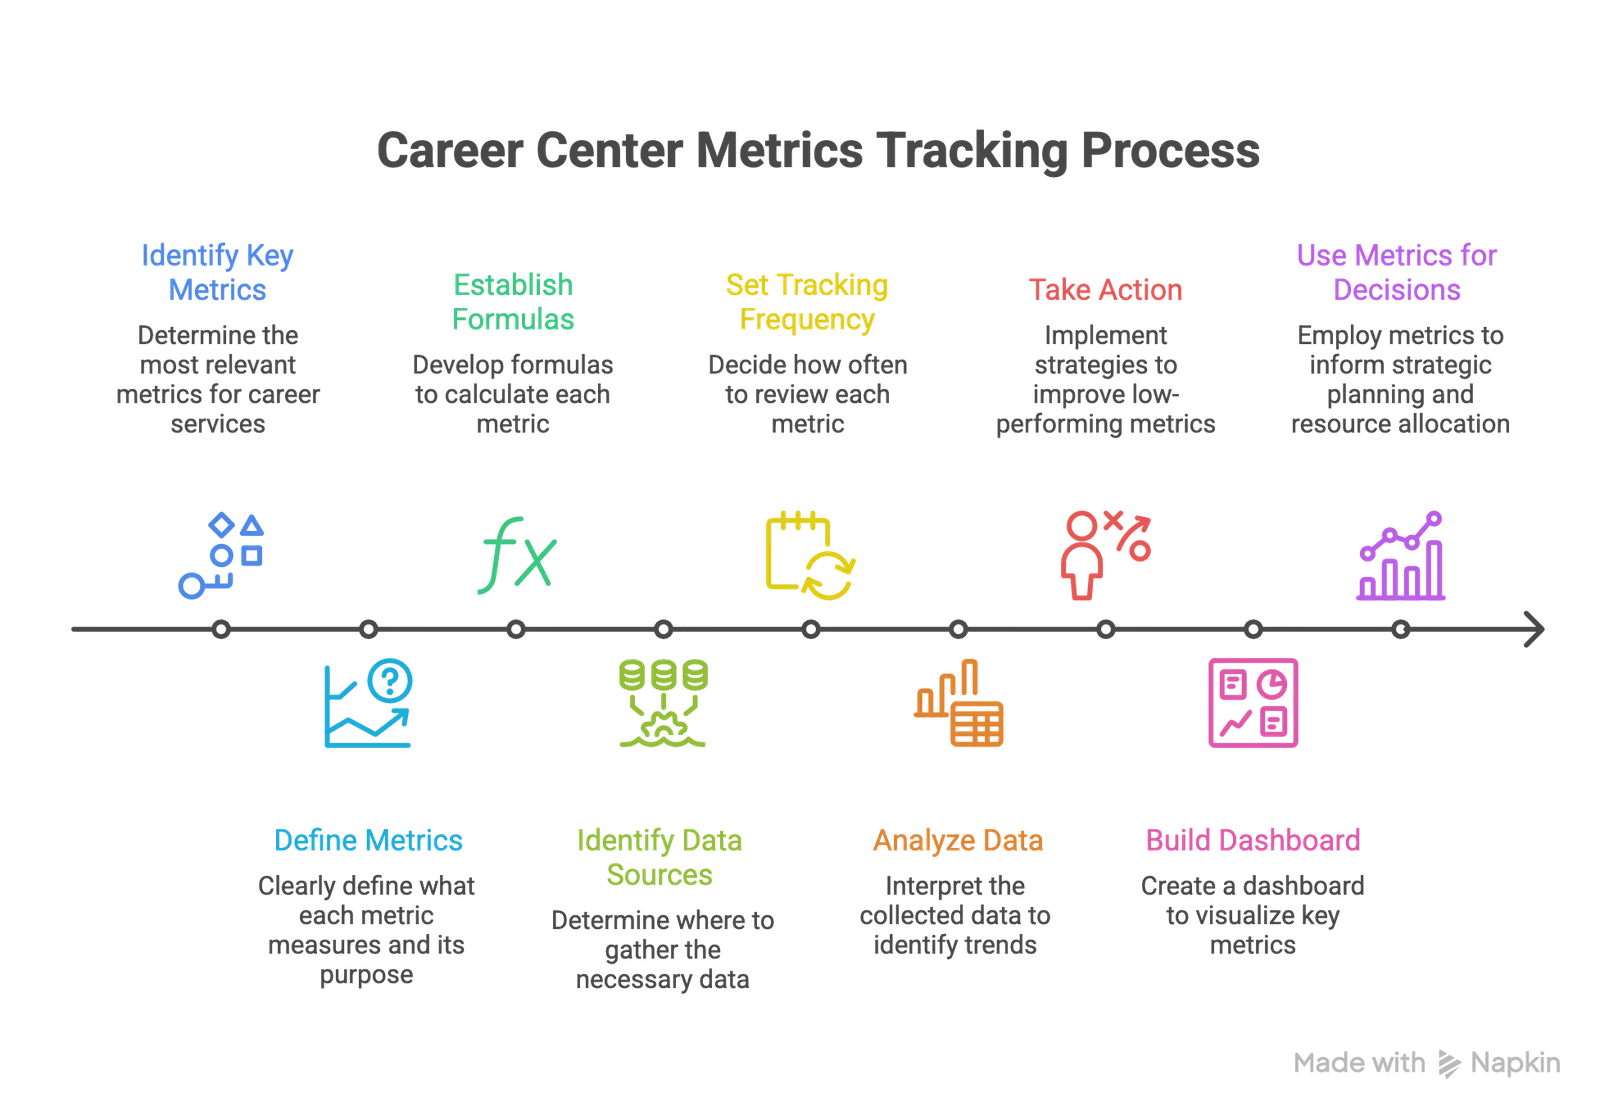
This guide breaks down 7 career center metrics every university should track, including what each KPI measures, the formula to use, where the data should come from, how often to review it, and what action to take when the number is low.
Career Center Metrics at a Glance
Use this table as a quick reference before going deeper into each KPI.
| Metric | What It Measures | Formula / Data Source | How Often to Track | What to Do If It Is Low |
|---|---|---|---|---|
| Student Career Readiness Score | Whether students can demonstrate key career competencies | Pre/post readiness assessments, NACE competency rubrics, advisor evaluations, or supervisor feedback | Start/end of semester, after workshops, and post-internship | Expand competency-based workshops, structured reflection, and evidence-building for resumes and interviews |
| Engagement-to-Outcome Ratio | Whether service usage leads to internships, jobs, or graduate outcomes | Students with positive outcomes who used services ÷ total students who used services | Semesterly and annually | Identify underperforming services and redesign interventions around stronger conversion outcomes |
| Employer Response Rate | Whether student applications are generating employer attention | Employer responses ÷ applications submitted | Monthly or campaign-based | Improve resume targeting, job alignment, and employer-facing application quality |
| Mock Interview-to-Real Interview Conversion | Whether mock interviews improve recruiting progression | Students receiving real interviews after mock interview completion ÷ total mock interview participants | Monthly or per recruiting cycle | Increase role-specific simulations and improve content, delivery, and feedback precision |
| Job Offer-to-Application Ratio | Whether students are applying strategically rather than excessively | Job offers received ÷ applications submitted | Monthly during active job search periods | Improve application strategy, job targeting, interview prep, and tailored resume support |
| Alumni Career Success Score | Long-term salary growth, mobility, and career relevance | Alumni surveys, LinkedIn outcomes, salary benchmarks, and job relevance indicators | Annually or every 2–3 years | Strengthen employer ecosystems, alumni mentoring, and long-term career readiness frameworks |
| Career Services ROI | Institutional value created relative to investment | Student outcomes influenced ÷ career center budget, adjusted for equity and qualitative institutional gains | Annually | Align funding requests with measurable student reach, outcome gains, operational efficiency, and institutional priorities |
How Can You Evaluate the Effectiveness of a University's Career Services?
Career services effectiveness should be evaluated across the full student journey, not through one placement rate or activity metric. A stronger measurement model looks at who engages, whether students become more prepared, how they progress through recruiting, what outcomes they achieve, and whether those results are consistent across student groups.
A practical evaluation framework looks like this:
| Evaluation area | What to measure | What it helps you understand |
|---|---|---|
| Access & engagement | unique students reached, repeat engagement, wait times, class-year participation | Whether students can and do access support |
| Job readiness | resume quality, interview performance, competency evidence, readiness milestones | Whether students are becoming better prepared |
| Recruiting conversion | employer response rate, application-to-interview rate, interview-to-offer rate | Where students are progressing or getting stuck |
| Placement outcomes | internships, employment, graduate school, job relevance, still-seeking status | Where students ultimately land |
| Employer engagement | active employers, postings, interviews, repeat participation, industry coverage | Whether employer relationships are creating opportunities |
| Equity | engagement and outcomes by major, class year, first-gen status, Pell eligibility, and other relevant groups | Whether access and outcomes are distributed consistently |
| Capacity | advisor caseload, turnaround time, students served, staff time | Whether the center can sustain its current service model |
The important step is connecting these layers.
For example, a center may have strong appointment volume but weak application-to-interview conversion. Another may report a strong overall placement rate while certain majors or student populations participate in career services at much lower rates.
Those are different performance problems and require different responses.
Metrics tell you what is happening inside your center. Benchmarks help you determine how those results compare with national data, peer institutions, or your own historical performance.
For comparison points, see our guide to career services benchmarks.
1. Student Career Readiness Score
A Student Career Readiness Score measures how prepared students are to enter the job market, not just whether they attended a workshop or booked an appointment.
This metric should be tied to clear competencies. NACE defines career readiness as the foundation from which students demonstrate core competencies that prepare them for workplace success and lifelong career management.
NACE’s eight competencies include Career & Self-Development, Communication, Critical Thinking, Equity & Inclusion, Leadership, Professionalism, Teamwork, and Technology.
The Equity & Inclusion competency is currently under review, so institutions should align usage with internal policy and legal guidance.
A strong readiness score should measure whether students can prove competencies through examples.
For instance, a student should not simply say they are a strong communicator. They should be able to describe a project, presentation, job, internship, or leadership experience where communication created a measurable or meaningful result.
Formula
You can calculate this in a few ways:
Average readiness score = total readiness ratings ÷ number of students assessed
Or:
Readiness completion rate = students meeting readiness benchmark ÷ total students assessed
What to measure
Track student confidence and evidence across areas such as:
- resume quality
- interview readiness
- networking confidence
- LinkedIn/profile strength
- ability to explain skills
- ability to use STAR examples
- understanding of target roles
- completion of career readiness milestones
Data sources
Use:
- career readiness self-assessments
- advisor rubrics
- mock interview scores
- resume review scores
- internship supervisor feedback
- course-embedded reflection assignments
- NACE competency-aligned assessments
How often to track
Track before and after major interventions:
- start and end of semester
- before and after a career course
- before and after an internship
- before and after mock interview programs
- before and after resume bootcamps
What to do if the score is low
If readiness scores are low, the issue may not be student motivation. It may be unclear expectations. Build programming that helps students translate experience into evidence.
For example:
- add competency reflection prompts after internships and campus jobs
- teach STAR storytelling earlier
- build resume workshops around skill evidence, not formatting alone
- use mock interviews to assess specific competencies
- ask faculty and supervisors to reinforce the same readiness language
2. Engagement-to-Outcome Ratio
Many career centers track how many students use services. Fewer track whether those interactions lead to internships, interviews, jobs, graduate school placement, or other positive outcomes.
That is where the Engagement-to-Outcome Ratio matters. It helps answer a strategic question: Are students who engage with career services actually seeing stronger outcomes?
This metric is especially useful because usage alone can be misleading. A center may report strong appointment volume, but if those students are not securing interviews or internships, the service mix may need improvement.
NACE’s First-Destination Survey captures how new college graduates fare within six months of graduation, and NACE’s Class of 2024 first-destination report draws on data from more than 360 institutions and more than 823,500 graduates.
That kind of outcomes structure gives career centers a useful model for connecting engagement to post-graduation results.
Formula
Engagement-to-Outcome Ratio = students with positive outcomes who used career services ÷ total students who used career services
You can also compare users and non-users:
Outcome lift = outcome rate among career center users − outcome rate among non-users
What to measure
Track whether students who engage with career services are more likely to:
- secure internships
- receive employer responses
- complete mock interviews
- receive job offers
- enroll in graduate school
- report higher career confidence
- complete readiness milestones
Data sources
Use:
- appointment records
- workshop attendance
- career platform usage
- mock interview completion
- resume review completion
- first-destination survey data
- internship records
- employer-reported outcomes
- student outcome surveys
How often to track
Review every semester and annually. For major programs, track cohort-level outcomes before and after the intervention.
What to do if the ratio is low
If engagement is not leading to outcomes, identify which services are underperforming.
Ask:
- Are students using only low-impact services?
- Are they engaging too late?
- Are mock interviews realistic enough?
- Are resume reviews role-specific enough?
- Are students applying to aligned opportunities?
- Are certain groups engaging but still not seeing outcomes?
A low ratio is not just a performance problem. It is a diagnostic signal. It tells you where support needs to become more targeted.
3. Employer Response Rate to Student Applications
Employer Response Rate shows whether student applications are earning attention from recruiters and hiring managers.
This is a practical quality metric. Students may submit many applications, but if few receive responses, the issue may be weak targeting, poor resume alignment, unclear experience, or applying too broadly.
This KPI helps career centers move from “students are applying” to “students are applying effectively.”
Formula
Employer Response Rate = employer responses received ÷ applications submitted
A response can include:
- recruiter email
- phone screen
- interview invite
- assessment request
- request for more information
- employer follow-up
What to measure
Track:
- application volume
- response volume
- response rate by major
- response rate by industry
- response rate by employer type
- response rate before and after resume coaching
- response rate by platform or job board
- response rate by application quality score
Data sources
Use:
- student job-search trackers
- career platform data
- employer CRM data
- student surveys
- advising notes
- alumni or employer feedback
- application campaign records
How often to track
Track monthly during active recruiting periods. For career courses or bootcamps, track before and after the program.
What to do if the rate is low
A low employer response rate usually points to one of three problems:
- Students are applying to poorly matched roles.
- Students are not tailoring materials enough.
- Students do not have enough visible skill evidence.
Career centers can respond by:
- teaching job description analysis
- adding resume keyword and skill alignment support
- helping students identify right-fit roles
- improving cover letter targeting
- building stronger employer-specific prep
- encouraging networking before applying
This metric is also useful for employer relations teams. If many students apply to a particular employer and receive few responses, the center may need a stronger employer conversation about expectations, fit, or candidate preparation.
4. Mock Interview-to-Real Interview Conversion
Mock interviews are valuable, but career centers should measure whether they lead to stronger interview outcomes.
The Mock Interview-to-Real Interview Conversion metric tracks whether students who complete mock interviews are more likely to receive real interviews, advance in hiring processes, or perform better in employer conversations.
This matters because interview prep should not be measured only by participation.
A student completing a mock interview is useful, but the real question is whether practice improves confidence, answer structure, communication, and employer readiness.
Formula
Mock Interview Conversion Rate = students who complete mock interviews and receive real interviews ÷ students who complete mock interviews
You can also track:
Interview advancement rate = students who move from first interview to next round ÷ students who complete first interviews
What to measure
Track:
- mock interview completion
- real interview invitations
- second-round interviews
- offer outcomes
- interview confidence score
- advisor feedback score
- AI or rubric-based performance score
- improvement between first and second mock interview
Data sources
Use:
- mock interview platform data
- advisor scoring rubrics
- student self-reports
- employer interview data
- post-appointment surveys
- first-destination survey follow-up
- interview outcome forms
How often to track
Review monthly during recruiting seasons and after major interview-prep campaigns.
What to do if conversion is low
A low conversion rate may mean students are practicing, but not practicing in the right way.
Career centers should check whether mock interviews are:
- tailored to target roles
- aligned with employer expectations
- giving feedback on answer content, not just delivery
- assessing structure using STAR or similar methods
- measuring speech clarity, pacing, confidence, and body language
- followed by a clear improvement plan
If the conversion rate remains low, career centers should also review whether the issue is earlier in the funnel: resume quality, employer targeting, or application strategy.
5. Job Offer-to-Application Ratio
Students often believe a successful job search is about submitting more applications. Career centers know the bigger issue is usually application quality.
The Job Offer-to-Application Ratio helps measure whether students are applying strategically. A high-volume, low-conversion job search can drain student motivation and create anxiety without improving outcomes.
This metric helps advisors shift coaching from “apply more” to “apply better.”
Formula
Job Offer-to-Application Ratio = job offers received ÷ applications submitted
You can also calculate by segment:
- by major
- by industry
- by class year
- by student group
- by employer type
- before and after coaching
What to measure
Track:
- total applications submitted
- interviews received
- offers received
- application-to-interview rate
- interview-to-offer rate
- role relevance
- job quality
- time to offer
- salary range where available
Data sources
Use:
- student job-search trackers
- advising notes
- career platform data
- employer reports
- student surveys
- first-destination outcomes
How often to track
Track monthly for graduating students and each semester for broader cohorts.
What to do if the ratio is low
A low offer-to-application ratio usually means students need support in one or more areas:
- targeting better-fit roles
- tailoring resumes
- improving cover letters
- preparing for interviews
- building stronger networking pathways
- applying earlier
- presenting clearer skill evidence
Career centers should also look for pattern differences. If one major has strong application volume but weak offers, students may need industry-specific prep.
If first-generation students are applying but not converting, the center may need more structured coaching on networking, interview expectations, or employer communication.
6. Alumni Career Success Score
Most career centers track outcomes shortly after graduation. That is important, but it is not the whole story.
An Alumni Career Success Score helps career centers understand longer-term career impact.
It can show whether graduates are working in aligned fields, progressing in salary, earning promotions, pursuing advanced education, or staying connected to the institution.
NACE’s first-destination framework focuses on outcomes within six months of graduation, which is a strong early benchmark.
But career centers can add long-term alumni measures to show how career support contributes to durable career mobility over time.
Formula
There is no single universal formula, but a practical Alumni Career Success Score can combine:
- employment status
- job relevance
- salary growth
- career satisfaction
- promotion or advancement
- graduate school completion
- alumni engagement
- employer or industry alignment
Example:
Alumni Career Success Score = weighted average of job relevance + salary competitiveness + career satisfaction + advancement + alumni engagement
What to measure
Track:
- employment status after 1, 3, and 5 years
- job relevance to major or career goal
- salary compared with field benchmarks
- time to first role
- promotion or career mobility
- graduate school enrollment or completion
- alumni willingness to mentor current students
- employer connections created through alumni
Data sources
Use:
- alumni surveys
- LinkedIn data
- institutional advancement data
- employer records
- public salary benchmarks
- first-destination data
- alumni engagement platforms
How often to track
Track annually or every 2-3 years, depending on institutional capacity.
What to do if the score is low
If alumni career success is weak, look for gaps in early career readiness and employer alignment.
Career centers can respond by:
- strengthening alumni mentoring
- building industry-specific pathways
- improving internship access
- adding career mobility programming
- using alumni examples in workshops
- partnering with advancement and academic departments
- tracking long-term outcomes by major and student group
Alumni data also supports employer partnerships. If graduates are performing well in certain industries, that can strengthen the case for deeper employer engagement.
7. Career Services ROI
Career Services ROI measures whether the career center is creating meaningful institutional value relative to its investment.
A simple version looks at outcomes compared with budget. But a stronger version should also include student reach, readiness gains, staff capacity, equity impact, employer engagement, and institutional reputation.
This matters because career centers are often asked to do more without a proportional increase in resources.
A strong ROI model helps leaders make the case for funding, staffing, and technology.
Gallup found that 52% of U.S. college graduates reported visiting their career services office at least once, but only 16% of those who visited said it was “very helpful.”
Graduates who found career services “very helpful” were also more likely to say their university prepared them well for life after college, say their education was worth the cost, and recommend their alma mater.
That makes ROI broader than job placement alone. A useful career center can influence student perception of institutional value.
Formula
A narrow formula:
Career Services ROI = jobs and internships influenced by career services ÷ career center budget
A stronger formula:
Career Services ROI = outcome gains + readiness gains + student reach + equity impact + staff capacity saved ÷ total investment
What to measure
Track:
- jobs and internships influenced
- first-destination outcomes
- career readiness gains
- service usage
- student satisfaction
- employer engagement
- staff time saved
- cost per engaged student
- cost per positive outcome
- equity improvements by student group
Data sources
Use:
- budget reports
- career center usage data
- first-destination survey
- student satisfaction surveys
- employer engagement records
- readiness assessments
- workflow analytics
- demographic usage data
How often to track
Review annually for budget and leadership reporting. Review leading indicators each semester.
What to do if ROI is hard to prove
If ROI is hard to demonstrate, the issue may be data structure rather than actual impact.
Career centers should:
- connect engagement data to outcome data
- track readiness gains before graduation
- measure staff time saved through technology
- disaggregate outcomes by student group
- compare users and non-users
- build dashboards for leadership reporting
- capture qualitative proof through student and employer stories
ROI should not reduce career services to one financial equation. It should show how the center supports student success, institutional value, and long-term career mobility.
Also Read: 7 Career Center Annual Report Examples for University Leaders
What Are the Best Career Center Systems for Reporting Placement Metrics?
The best career center systems for reporting placement metrics are the ones that can connect student engagement, job readiness, employer activity, recruiting progress, and graduate outcomes around the same student or cohort.
A system that can produce a placement percentage but cannot show what happened before that outcome gives career leaders only part of the picture.
When evaluating systems, focus on the reporting capability you need:
| Reporting need | What the system should capture | Questions it should help answer |
|---|---|---|
| Placement outcomes | employment, internships, graduate school, still-seeking status, salary, job relevance | Where did students land? |
| Engagement-to-outcome reporting | appointments, workshops, platform activity, resume reviews linked to outcomes | Which students engaged before reaching an outcome? |
| Job readiness tracking | resume progress, interview practice, assessments, competency evidence, milestone completion | Are students becoming more prepared before recruiting? |
| Recruiting conversion | applications, employer responses, interviews, offers | Where are students dropping out of the hiring funnel? |
| Employer engagement | active employers, postings, events, interview requests, repeat participation | Which employer relationships are creating opportunities? |
| Cohort and equity reporting | major, college, class year, student group, program | Which groups are engaging and progressing differently? |
| Long-term alumni outcomes | employment, advancement, salary movement, career relevance | What happens after the first-destination reporting window? |
| Leadership reporting | dashboards, exports, longitudinal trends, college-level breakdowns | Can leadership see patterns without rebuilding reports manually? |
The goal is not necessarily to find one tool that does everything.
The important question is whether your systems can share enough data to create a connected view of student progress.
What should career centers look for in tools that track effectiveness?
When comparing tools to track the effectiveness of university career services, ask:
- Can we follow the same student from engagement through readiness and outcomes?
- Can we distinguish meaningful actions from simple logins?
- Can we segment results by major, college, class year, cohort, or student group?
- Can we track applications, interviews, offers, and placement outcomes?
- Can employer activity be connected to actual student opportunities?
- Can advisors identify students who are inactive, stuck, or below readiness expectations?
- Can data be exported or integrated with institutional reporting systems?
- Can we compare results over time rather than viewing only current totals?
- Can the system support both operational decisions and leadership reporting?
If the answer to most of these questions is no, the problem may not be a lack of metrics. It may be that the center's data is fragmented across systems that were never designed to show the full student journey.
For teams specifically improving graduate outcome reporting, these First Destination Survey dashboard examples show how institutions can structure placement data for clearer analysis.
How Should Career Centers Use Their Metrics?
Career center metrics only matter if they lead to decisions. Instead of treating data as an annual reporting exercise, organize your metrics across engagement, readiness, outcomes, equity, employer activity, and staff capacity so your team can quickly see where students are progressing and where intervention is needed.
Use the data to answer questions such as:
- Which students or cohorts need earlier outreach?
- Which services are translating into stronger readiness or outcomes?
- Where are students dropping off between applications, interviews, and offers?
- Which majors or student groups are under-engaged?
- Which employer relationships are creating meaningful opportunities?
- Where is advisor capacity becoming constrained?
- Which programs or investments should be expanded, redesigned, or discontinued?
The goal is not to track more data. It is to create a feedback loop between student behavior, advisor support, employer demand, and outcomes so the numbers influence what your team does next.
If you are deciding how to structure these measures into a usable reporting view, see our guide to career center dashboard best practices.
Final Thoughts
Career center metrics are most useful when they move beyond activity counts. Appointments, workshops, and resume reviews matter, but they are only part of the story.
Universities also need to know whether students are becoming more career-ready, whether services are influencing outcomes, whether employers are responding, and whether support is reaching students equitably.
The strongest measurement systems connect engagement, readiness, outcomes, equity, employer demand, and staff capacity. That gives career centers a clearer way to improve programs, justify investment, and demonstrate institutional value.
Hiration supports this work with a full-stack career readiness suite designed for higher education. It includes Career Assessments, AI-powered Resume Optimization, Interview Simulation, LinkedIn and cover letter support, and a dedicated Counselor Module for managing cohorts, workflows, and analytics within a secure, FERPA and SOC 2-compliant platform.
When career centers can track student progress across the full journey, teams can move from reporting activity to proving impact.