For deans and senior leadership, career centers are increasingly expected to demonstrate measurable impact beyond activity reports.
Universities want to understand how career services contribute to institutional goals like enrollment, retention, and alumni giving, but current reporting often fails to connect the dots.
This guide provides a career center ROI framework for deans and leadership, detailing how to translate operational metrics into a compelling narrative of institutional value.
What does career center ROI mean to deans and leadership?
For deans and leadership, ROI is not a tally of appointments or workshops. It is a quantifiable link between the career center’s budget and its impact on the university's core objectives, such as enrollment, retention, and long-term financial health. The conversation must shift from reporting on inputs (students served) to demonstrating outcomes (what students achieved) and value (how their success benefits the institution).
This reframes the career center from a perceived cost center into a strategic asset.
With tightening budgets and rising student expectations for tangible career outcomes, leadership requires proof of value.
A robust ROI framework provides this proof by translating career center activities into the language of institutional strategy, connecting every dollar spent to measurable gains in student success and institutional reputation.
Students navigate a landscape with over 1.1 million U.S. credentials, where only 12% deliver significant wage gains, according to research from the Burning Glass Institute.
Proving value is not just a defensive move; it is a strategic necessity.
A clear ROI framework traces investment from initial resources to measurable student outcomes and, ultimately, to the institutional value that resonates with leadership.

This model illustrates that inputs only matter when directly tied to tangible outcomes and institutional value - the narrative that captures leadership's attention.
The Three Pillars of a Career Center ROI Framework
An effective ROI framework for deans and leadership must be built on three pillars that connect career services work to institutional strategy. Each pillar answers a different strategic question, building a comprehensive case for the career center's value beyond simple activity metrics.
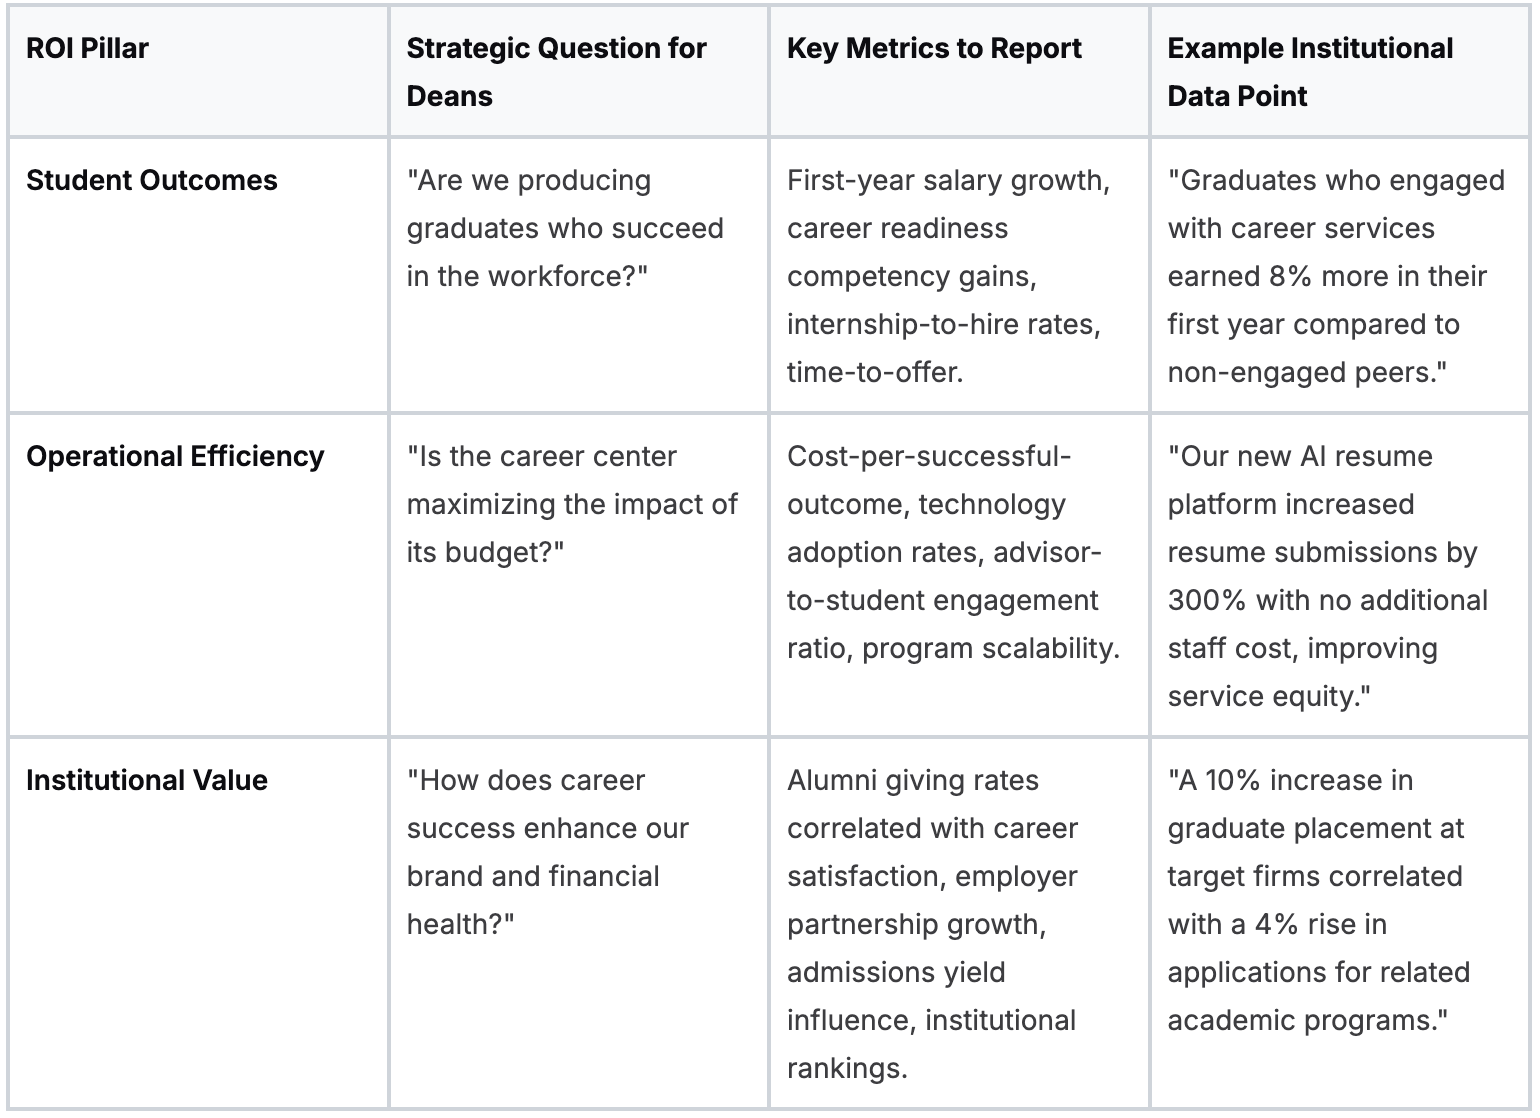
These pillars work in concert to tell a complete story.
For example, showing how a new advising technology (Operational Efficiency) led to a 15% increase in students securing paid internships (Student Outcomes), which in turn attracted more high-achieving applicants (Institutional Value), creates a powerful, multi-faceted narrative of impact.
This holistic view, detailed further in our guide on showing career center ROI impact, is what secures resources and a strategic seat at the table.
How can we frame outcomes beyond placement rates?
To prove a career center's true value, reporting must move beyond lagging indicators like first-destination placement rates. A robust ROI framework focuses on leading indicators that demonstrate deeper and sustained impact on student development. These include measurable gains in career readiness, the center’s contribution to student retention, and the long-term career velocity of alumni.
This approach shows that the center does not simply help students find their first job. It prepares them for long-term professional advancement.
Measuring Career Readiness Gains
Instead of only asking “where did students land?”, a more strategic question is “how prepared were they to launch?” The goal is to demonstrate measurable growth in career competencies from a student's first year to graduation, creating longitudinal evidence that traditional first-destination surveys often miss.
Baseline and Exit Assessments:
Implement structured assessments at first-year orientation and again before graduation using a consistent rubric such as the eight NACE Career Readiness Competencies. This allows institutions to compare baseline and exit results to demonstrate measurable growth.
Data-Backed Reporting:
Present findings such as: “Our data shows a 28% average increase in the ‘Critical Thinking’ competency for students who completed our structured internship program, compared to a 9% increase for those who did not.”
The real value emerges when the data is segmented by major, demographic group, or program participation.
This makes it possible to identify which interventions deliver the strongest outcomes and where resources should be focused.
Tracking Career-Linked Retention
Another powerful but often overlooked metric is the career center’s influence on student retention. Students who feel confident about their career direction are more likely to remain enrolled and complete their degrees.
Connecting career services engagement to this institutional priority creates a compelling strategic argument.
Wake Forest University provides a useful example with its “College to Career” initiatives, which integrate career planning into the student experience from the first year.
By tracking engagement with career advisors and correlating that engagement with retention data from the registrar, the institution can demonstrate that early career exploration contributes to academic persistence.
To build this case:
- Tag High-Impact Activities: Use a CRM to tag students who participate in activities such as creating a four-year career plan or attending an industry trek.
- Partner with Institutional Research: Work with the institutional research team to compare retention rates between students who engaged with career services and those who did not.
- Report the Correlation: Share insights such as: “First-generation students who met with a career advisor during their first semester showed a 7% higher sophomore-year retention rate.”
Focusing on Long-Term Career Velocity
The most compelling ROI extends beyond the first six months after graduation. “Career velocity”, the speed and trajectory of alumni career progression, demonstrates that an institution produces graduates who advance quickly and assume leadership roles.
- Longitudinal Alumni Surveys: Conduct surveys at two, five, and ten years after graduation to track promotions, salary progression, leadership responsibilities, and career satisfaction.
- LinkedIn Data Analysis: Analyze alumni career paths at scale by tracking the percentage of graduates who reach “Senior,” “Manager,” or “Director” roles within five years.
- Systematic Employer Feedback: Gather structured feedback from key employer partners about the promotability and leadership potential of your alumni compared with graduates from peer institutions.
Taken together, these indicators - career readiness growth, retention impact, and long-term career velocity, create a comprehensive view of career center value.
Our guide on reporting templates for career centers provides frameworks for structuring these insights.
How can we connect operational efficiency to student outcomes?
Operational efficiency in a career center is not just about cost-cutting; it is about strategically reallocating finite resources - time, budget, and staff, from low-impact administrative tasks to high-impact student engagement. For a dean, this reframes technology investments or workflow changes as direct drivers of student success outcomes, shifting the conversation from “cost per appointment” to the more meaningful metric of “cost per successful outcome.”
A new platform is not simply a budget line item; it becomes a mechanism to scale impact and improve the metrics for which leadership is accountable.

The Operational Value Chain
To clearly connect efficiency with outcomes, career centers can use an Operational Value Chain model. This framework traces a direct path from budget decisions to measurable student achievements through three stages:
- Operational Input: The resource deployed (for example, a 24/7 AI resume review tool).
- Student Behavior Change: The measurable action students take as a result (for example, a 300% increase in students creating targeted resumes).
- Verifiable Outcome: The concrete proof of impact (for example, a 25% increase in interview invitations reported by that group).
For example, implementing a platform like Hiration (Operational Input) can lead to a measurable increase in students producing higher-quality application materials (Student Behavior), which may correlate with increased interview invitations (Verifiable Outcome).
This model demonstrates how investments in operational efficiency can translate into improved student outcomes.
Calculating Cost Per Successful Outcome
To make ROI more tangible for leadership, career centers can calculate cost per successful outcome. This metric connects budget spending directly to the results institutions prioritize.
First, define a “successful outcome” clearly, for example, a student securing a paid internship or a graduate receiving a job offer in their field of study.
Next, identify the direct costs associated with achieving that outcome, such as staff time, software licenses, and program expenses.
The formula is:
Total Program Cost ÷ Number of Successful Outcomes = Cost Per Successful Outcome
This metric shifts the conversation. Instead of defending the cost of a tool or program, career centers demonstrate the efficiency with which they produce successful graduates.
For a deeper breakdown of budgeting approaches, a separate guide on career center budget optimization can provide additional frameworks.
The Urgency of Scalable Systems
The need for operational efficiency is also driven by structural constraints. The NACE 2024-25 Career Services Benchmarks Report indicates a median student-to-staff ratio of 1,381:1, which means most teams must serve large student populations with limited personnel.
The same report notes that 29.3% of career centers currently use competency assessments to track skill development, suggesting significant room for institutions to strengthen data-driven reporting.
Because of these pressures, scalable systems that extend staff capacity are increasingly important.
Exploring career technology platforms and workflow automation tools is becoming a core strategy for expanding support while maintaining measurable impact.
How should we report value to provosts and deans?
When reporting to a provost or dean, the most common mistake is presenting raw data without a clear narrative. Your role is to connect career center activities to the strategic questions leadership is already trying to answer. Frame metrics as responses to institutional priorities rather than isolated statistics. For example, instead of labeling a metric simply as “placement rate,” present it as “Contribution to Post-Graduation Success” to immediately signal institutional relevance.
This approach reflects data-driven leadership by moving beyond operational reporting and demonstrating how career center work supports the university’s broader mission.
The Executive ROI Dashboard
An effective report for senior leadership should be readable in under five minutes and organized around their main strategic concerns. Each metric should answer a specific leadership question.
For instance, Bentley University’s career services reporting benchmarks graduate salaries against national averages and analyzes outcomes by major. This type of presentation helps illustrate the tangible return on investment of a Bentley education, turning raw numbers into a clear institutional value narrative.
Executive ROI Dashboard Template for Provosts and Deans
This dashboard acts as a strategic communication tool. It translates career center activity into the language of institutional impact by directly linking operational metrics to leadership priorities such as student success, retention, and institutional reputation.
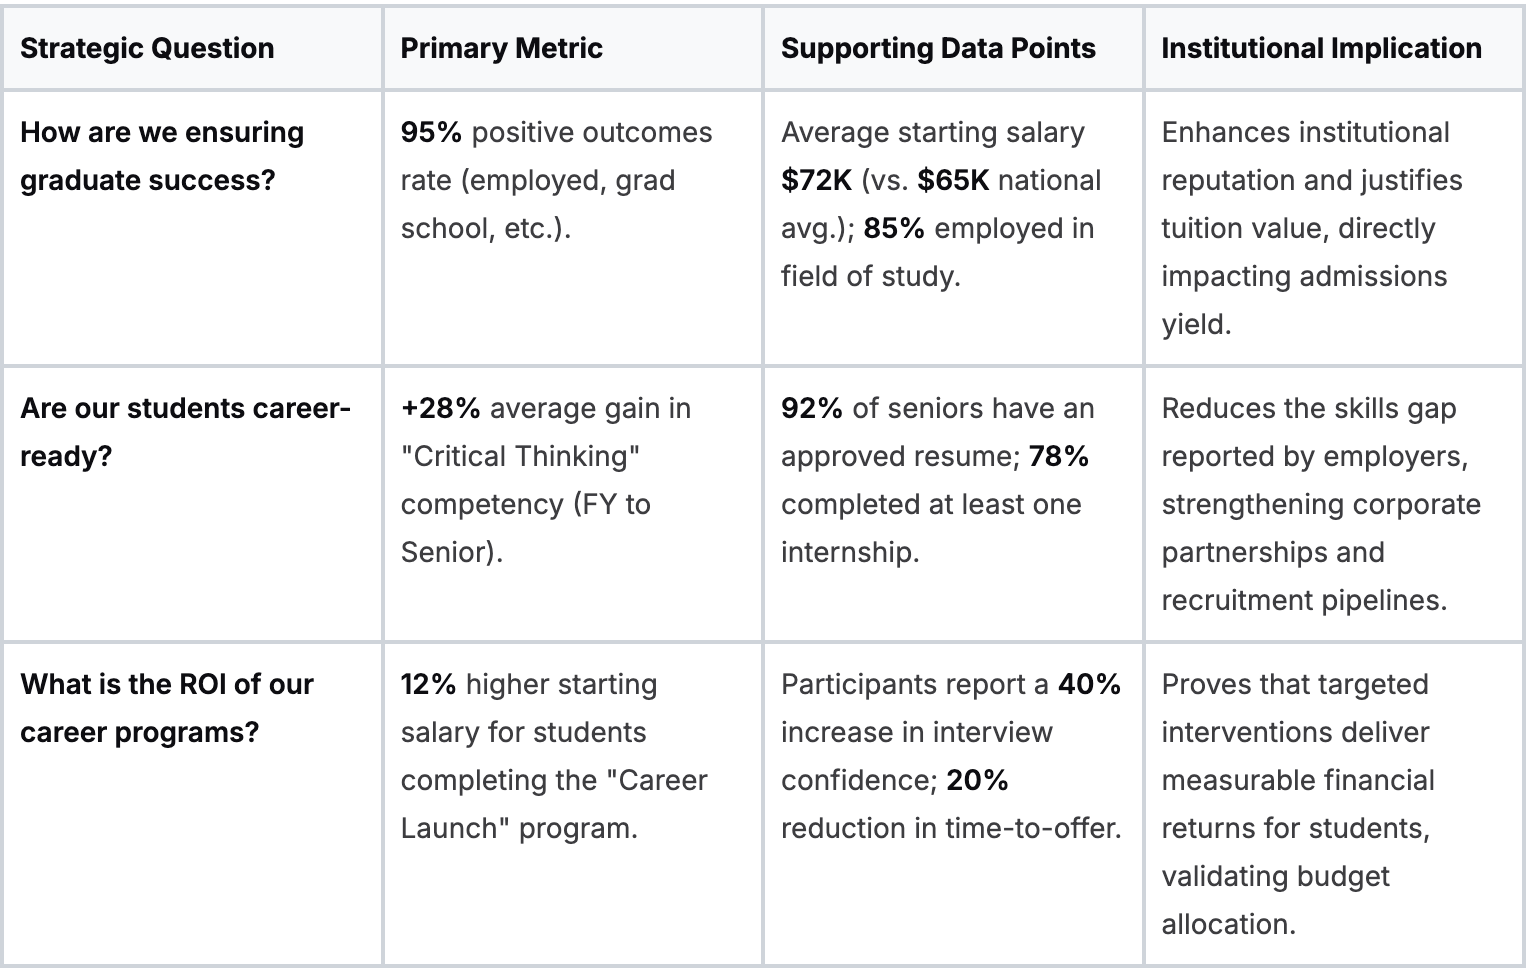
By framing metrics this way, you shift from reporting activities to demonstrating influence.
This strategic alignment is critical for developing more robust reporting systems, and our guide on top career center metrics provides additional examples.
Presenting data in this format positions the career center as an essential partner in advancing the university's mission.
Wrapping Up
Career centers today must demonstrate more than activity, they must show clear institutional value.
For deans and provosts, the most compelling reports connect career services work to outcomes that matter: retention, career readiness, and long-term alumni success.
When centers adopt structured ROI frameworks and clear executive dashboards, the narrative shifts from operational reporting to strategic impact.
Hiration supports this by providing an integrated career readiness suite, from career assessments to AI-powered resume optimization and interview simulations, along with a counselor module for managing cohorts, workflows, and analytics within a FERPA and SOC 2-compliant platform.
Together, these tools help career centers scale support while demonstrating measurable outcomes.