What makes an effective career center annual report for university leadership?
An effective career center annual report connects career services activity to measurable institutional outcomes such as student retention, internship participation, and graduate employment. Strong reports combine clear metrics, data visualizations, and narrative storytelling to demonstrate how career services contribute to student success and institutional strategy.
What makes an effective career center annual report for university leadership? An effective career center annual report connects career services activity to measurable institutional outcomes such as student retention, internship participation, and graduate employment. Strong reports combine clear metrics, data visualizations, and narrative storytelling to demonstrate how career services contribute to student success and institutional strategy.
Many career center annual reports are reactive data dumps that fail to secure budget increases or influence institutional strategy.
Provosts and deans are not looking for participation numbers; they demand a clear, evidence-based connection between career services investment and critical student outcomes like retention and first-destination success.
A report filled with vanity metrics signals operational activity, not strategic impact, leaving leadership unconvinced of the center's value and threatening its resources.
This guide breaks down seven high-impact career center annual report examples from leading institutions, analyzing the metrics, narrative framing, and visualizations that successfully communicate ROI to university leadership.
What Core Sections Should a Career Center Annual Report Include?
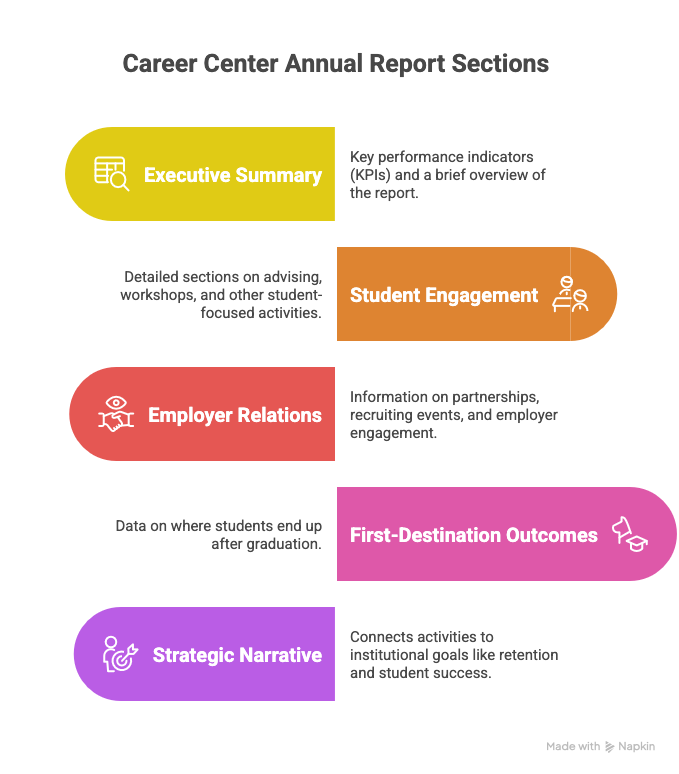
A strong career center annual report should include an executive summary with key performance indicators (KPIs), detailed sections on student engagement (advising, workshops), employer relations (partnerships, recruiting events), and first-destination outcomes. It must also feature a strategic narrative connecting these activities to institutional goals like retention and student success, supported by compelling data visualizations.
Effective reports move beyond activity metrics to demonstrate impact.
The University of Florida (UF) Career Connections Center’s annual report is a premier example of a public-facing, narrative-rich website that balances storytelling with hard data.
Designed for a wide audience including university leadership, prospective students, and corporate partners, it avoids the static nature of a PDF.
Instead, UF presents its achievements as an interactive web page, effectively demonstrating institutional collaboration and the direct impact of its programs on student success.
Key takeaways your career center can adapt:
- Structure as a Story: Frame data around a central narrative like UF's "Career Pathways" to turn accomplishments into a powerful impact statement.
- Adopt a Web-First Format: A dynamic microsite improves accessibility, allows for embedded media, and provides analytics on viewership.
- Quantify Partnerships: Showcase the value of employer relationships (e.g., number of jobs posted, exclusive events) to demonstrate ROI.
- Integrate Platform Analytics: Move beyond attendance by highlighting metrics like the number of students achieving a high resume score. Explore key career center metrics for more ideas.
What Are the Most Important Metrics for an Annual Report?
The most important metrics connect career services activities to institutional priorities like student success, retention, and enrollment. Key metrics include first-destination success rates (employment/grad school), knowledge rate, student engagement segmented by college and demographic, internship participation rates, and employer partnership growth. These metrics demonstrate ROI beyond simple attendance numbers.
The University of California, Riverside (UCR) Career Center's annual report is a model of efficiency, presenting a metrics-forward landing page that delivers key performance indicators at a glance.
It is designed for stakeholders, particularly executive leadership, who need a quick, high-level overview.
By focusing on headline numbers like student contacts, website visits, and Handshake activity, UCR provides a scannable snapshot of its reach and engagement.
Key takeaways your career center can adapt:
- Create an "At-a-Glance" Dashboard: Highlight 3-5 KPIs prominently at the top of your report for busy leaders.
- Align KPIs with Core Values: Frame metrics as evidence of your guiding principles (e.g., "Our 10,000+ advising appointments reflect our commitment to personalized access").
- Highlight Technology Engagement: Report on logins and usage of key platforms to demonstrate digital resource adoption.
- Focus on Leading Indicators: Use engagement metrics (appointments, attendance) to prove the center is a vital campus hub.
UC Riverside's report highlights top-line engagement figures like student contacts and Handshake activity, but it crucially frames these as leading indicators of eventual outcomes.
This positions high engagement as evidence of the center's vital role in the student lifecycle, a necessary precursor to positive post-graduation results.
How Can a Report's Narrative Frame Data for University Leadership?
A report's narrative should frame data as evidence supporting a central strategic theme, such as "closing equity gaps" or "scaling career readiness." Instead of a simple list of accomplishments, the narrative must explicitly connect operational metrics to the university's strategic plan, answering the "so what?" for leadership.
For instance, a report might open by stating the university's goal of improving post-graduation outcomes for first-generation students.
It would then present data showing targeted outreach, increased advising appointments for that cohort, and a subsequent rise in their internship participation rates.
Cal State Fullerton's model of creating college-specific infographics is an excellent example of targeted narrative framing.
A dean receives a report that tells a story about their students, making the career center's impact tangible and directly relevant to their own strategic priorities.
This model is exceptionally well-suited for large, decentralized institutions where communicating impact to specific deans and departments is critical.
It provides both a high-level overview and granular, stakeholder-specific insights, strengthening the case for departmental collaboration.
Key takeaways your career center can adapt:
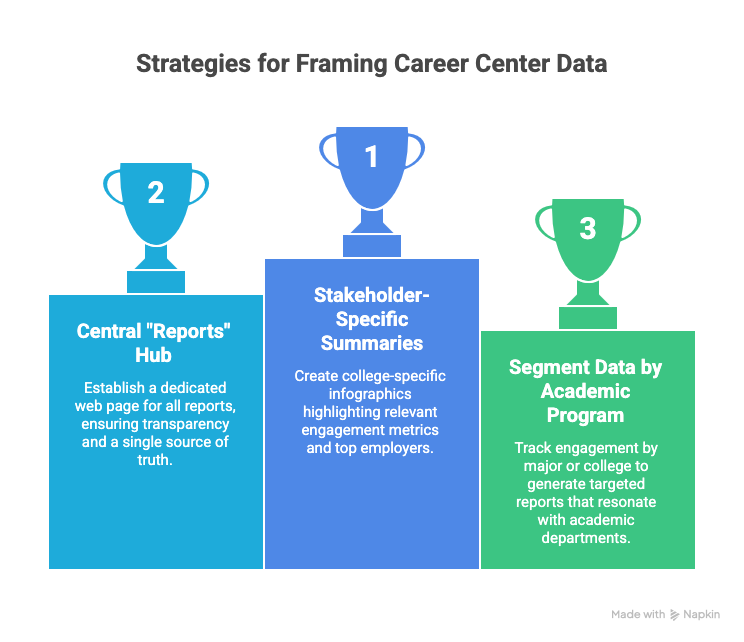
- Create Stakeholder-Specific Summaries: Develop one-page infographic summaries for each college, highlighting relevant engagement metrics and top employers.
- Build a Central "Reports" Hub: A dedicated web page for all reports establishes a single source of truth and demonstrates a commitment to transparency.
- Segment Data by Academic Program: Track engagement by major or college to generate targeted reports that resonate with academic departments.
- Visualize Key Metrics: Use an infographic-first design with charts, icons, and call-outs to present data for maximum scannability.
What Are the Most Effective Data Visualizations for an Annual Report?
The most effective visualizations for a career center annual report are those that make complex data immediately understandable for a non-expert audience. These include year-over-year bar charts showing growth, stacked bar charts disaggregating engagement by college or demographic, and maps illustrating the geographic distribution of internships or graduate outcomes.
Pie charts are often misused; a simple table or bar chart is usually clearer for showing proportions.
The key is to select a visualization that answers a specific question.
For example, a bar chart comparing internship participation rates between aided and non-aided students powerfully visualizes an equity gap.
As shown in the University of Oklahoma's reports, simple visualizations of year-over-year trends in advising appointments or career fair attendance provide immediate, compelling proof of growing demand and scale.
Their career center uses a dual-format approach, combining detailed, multi-page annual reports with concise, "year at a glance" summaries.
This allows the center to deliver in-depth analysis for internal audiences like deans while also providing quick, shareable snapshots for prospective students, parents, and employer partners.
The "year at a glance" documents are particularly effective as standalone assets for presentations and recruitment.
Key takeaways your career center can adapt:
- Create a "Year at a Glance" Summary: Distill your full report into a one-page visual infographic with 5-7 core metrics.
- Develop College-Specific Breakdowns: Create summary pages within your report for each college, highlighting top employers and internship data for their majors.
- Visualize Year-Over-Year Data: Use simple bar or line graphs to show growth in key areas like platform usage or event participation over the past 3-5 years.
- Connect Usage to Outcomes: Correlate high activity numbers (e.g., resume reviews) with improved first-destination survey outcomes to demonstrate impact.
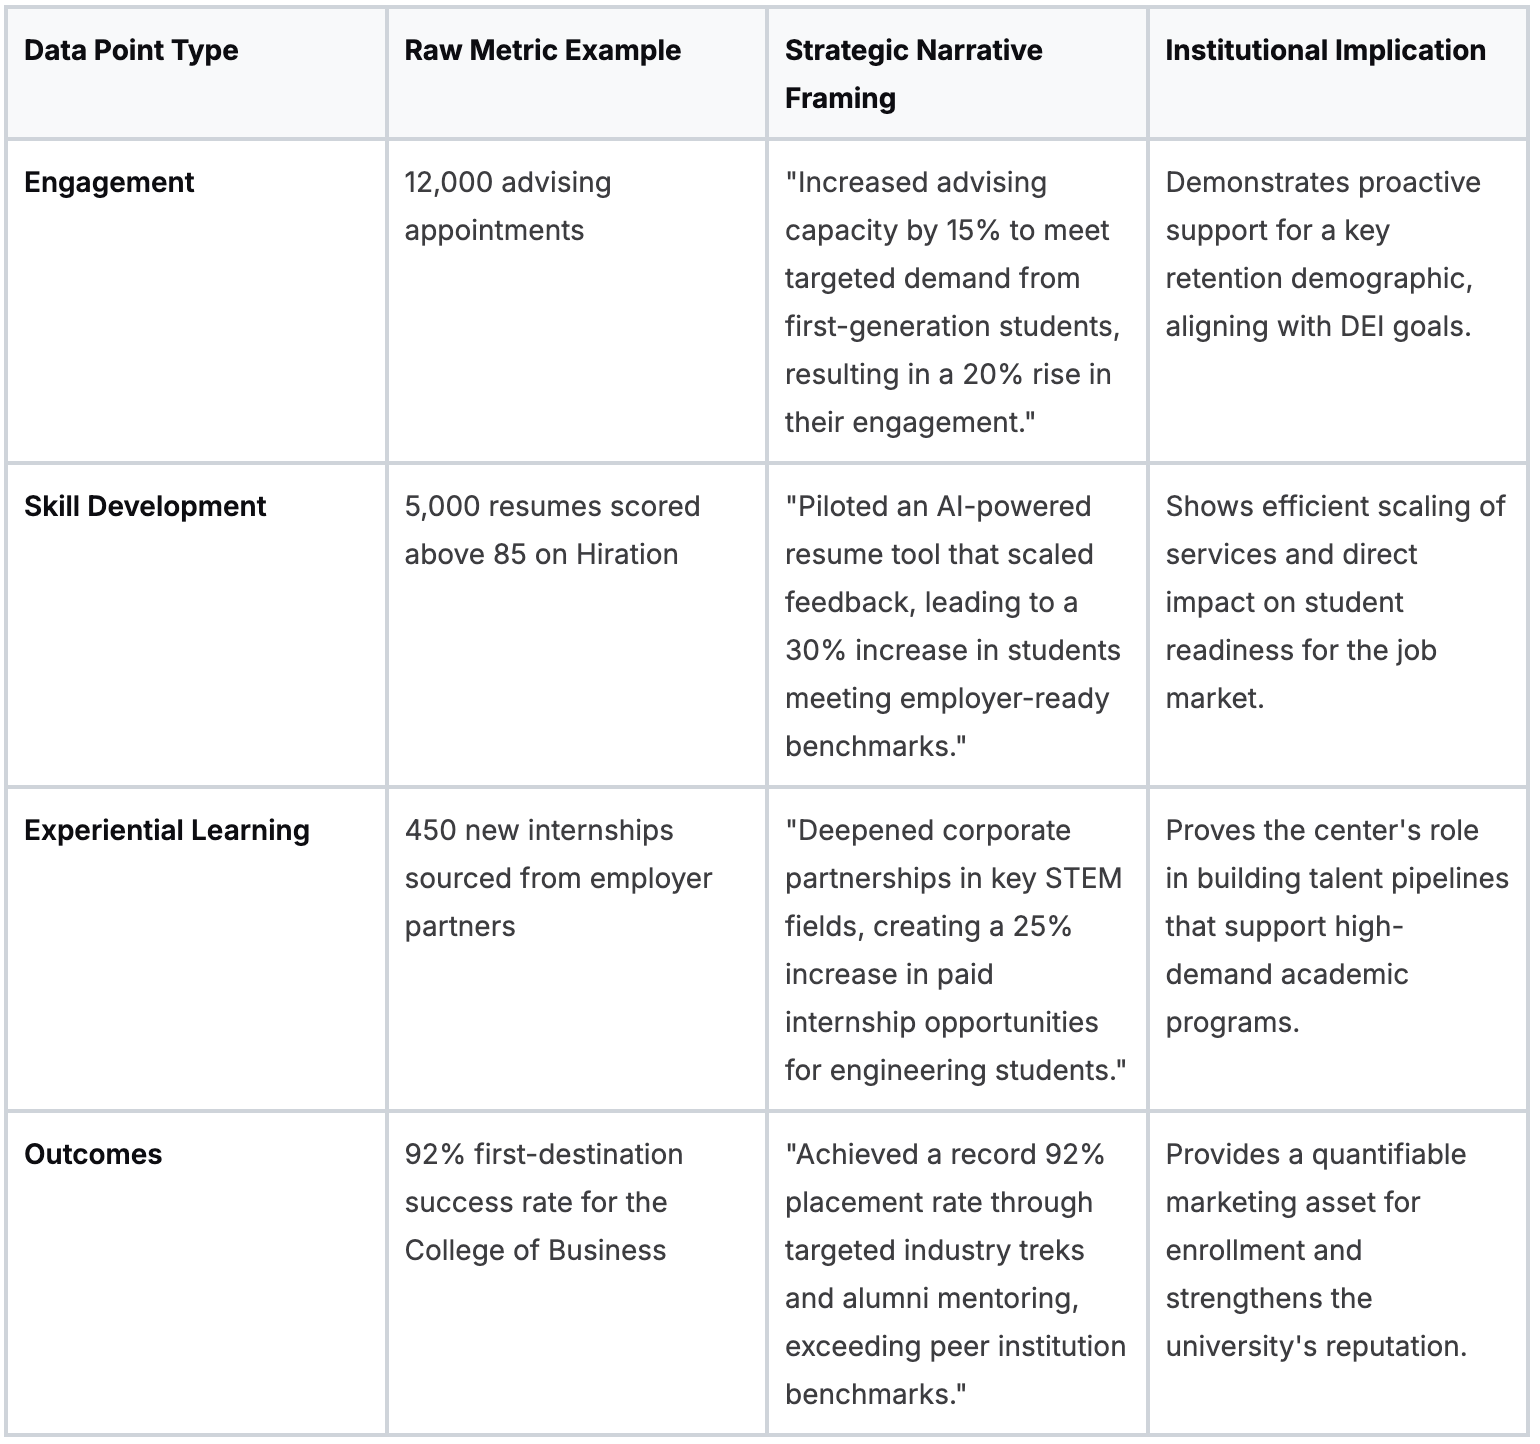
From Data Points to Strategic Narrative: A Framework
To build a compelling report, career centers must translate raw data into a narrative that resonates with institutional leadership. This requires connecting operational metrics to demonstrable student progress and institutional value.
What are some more examples of effective career center annual reports?
Baylor University
Baylor University’s Career Center offers a public-facing hub with annual reports spanning multiple years, a model for demonstrating consistency and tracking progress over time.
For career centers aiming to build institutional memory and provide stakeholders with a clear view of multi-year trends, Baylor’s strategy of creating a standardized series of reports is an excellent blueprint.
The consistency in layout makes comparative analysis simple for leadership.
Key takeaways your career center can adapt:
- Establish a Report Archive: Create a dedicated page on your website to host multiple years of your annual report to show a commitment to transparency and long-term assessment.
- Standardize Your Template: Use a consistent template year after year to save time and make it easier to compare data across periods.
- Highlight Longitudinal Trends: Include a section that explicitly compares the current year’s data to previous years to add a powerful layer of context.
- Align Metrics with Benchmarks: Use your historical data as an internal benchmark for success and compare trends against established career services benchmarks.
Clemson Univesity
Clemson University’s report is a strong example of framing an annual summary within a specific academic cycle (August 15, 2022-August 14, 2023).
This aligns career services activities with broader institutional reporting schedules and is highly practical for accreditation or board reviews.
Its strength lies in its comprehensive scope, summarizing services for undergraduates, graduate students, and recent alumni with clarity and directness.
Key takeaways your career center can adapt:
- Define a Clear Reporting Window: Set a specific start and end date for your report (e.g., academic year, fiscal year) to simplify data collection and improve trend analysis accuracy.
- Segment Data by Audience: Structure your report to show how you serve undergraduates, graduate students, specific colleges, and alumni to demonstrate broad institutional value.
- Prioritize Clarity Over Complexity: A well-organized, data-forward web page can be more effective than an under-resourced interactive site.
- Connect Data to Your Team: Include staff information to add a human element and turn a static report into a gateway for future partnerships.
Swarthmore College
Swarthmore College’s Career Center takes an archival approach, presenting a channel-style repository of reports. Each report is organized thematically, allowing stakeholders to track the center's strategic evolution (e.g., pivot to virtual services, focus on partnerships). This format is ideal for centers that wish to demonstrate long-term strategic continuity and adaptability in a clear, accessible manner.
Key takeaways your career center can adapt:
- Create a Thematic Archive: Organize past reports by year and assign a clear theme to each (e.g., "2022: Expanding Experiential Learning") to show strategic continuity.
- Use Summaries as a Gateway: On your archive page, write a brief, 2-3 sentence summary for each report to entice stakeholders to click through for full details.
- Show Strategic Evolution: Use the series of reports to demonstrate how insights from one year’s data informed the strategy for the following year.
- Detail Programmatic Impact: Add granularity with platform-specific data, such as the average resume score improvement after appointments or mock interview completion rates.
Wrapping Up
Career center annual reports are strategic tools that show how career services contribute to student success, institutional priorities, and post-graduation outcomes.
The strongest reports move beyond activity counts and connect advising, employer engagement, and career readiness programs directly to measurable impact.
As the examples in this guide show, leading universities are using dashboards, visual summaries, and multi-year report hubs to make career center outcomes clearer to provosts, deans, and external stakeholders.
Producing this level of insight requires strong data and scalable career readiness infrastructure.
Hiration helps career centers support the full student journey - from career assessments and AI-powered resume optimization to interview simulations, while giving counselors tools to manage cohorts, workflows, and analytics within a secure FERPA- and SOC 2-compliant system.
Ultimately, the goal of any annual report is simple: clearly demonstrate how career services help students move from education to meaningful employment.
Career Center Annual Reports — FAQs
Why are career center annual reports important for university leadership?
Annual reports help career centers demonstrate their contribution to institutional priorities such as graduate employment outcomes, student retention, and employer partnerships. They provide leadership with clear evidence of impact and return on investment.
What sections should a strong career center annual report include?
Effective reports typically include an executive summary, student engagement metrics, employer partnership activity, first-destination outcomes, and a strategic narrative connecting these results to broader university goals.
What metrics matter most in a career center annual report?
Key metrics include employment and graduate school placement rates, first-destination survey knowledge rate, internship participation, employer engagement, student advising appointments, and career platform usage.
How should career centers present data to university leadership?
Data should be framed through a clear narrative that links activities to outcomes. Visual dashboards, infographics, and year-over-year comparisons help leadership quickly understand trends and institutional impact.
Why are data visualizations important in annual reports?
Visualizations such as bar charts, trend lines, and dashboards make complex information easier to interpret. They help stakeholders quickly identify growth, gaps, and progress across different programs and student populations.
How can career centers tailor reports for different stakeholders?
Many institutions create summarized versions of their reports for specific audiences such as deans, admissions teams, and employer partners. These summaries highlight metrics and outcomes most relevant to each group.
What role do first-destination surveys play in annual reports?
First-destination surveys provide data on graduate employment, graduate school enrollment, and other outcomes. These insights help institutions measure how effectively they support students transitioning into the workforce.
What is the ultimate goal of a career center annual report?
The goal is to demonstrate how career services help students convert their education into meaningful employment and long-term career success while strengthening the university’s reputation and value proposition.